Sciences - Astronomy
Observing the Universe - Quasars - Expansion of the Universe
The Universe
Practise - Observing
Our Galaxy - The Milky Way
Galaxies
Quasars - Expansion of the Universe


Presentation of Quasars

Quasars are fantastic objects. They are not photogenic. They have the appearance of stars, the name quasar is well found as for "quasi star". They are very distant, they are located much further than all the visible stars of the Galaxy and to be seen this way, they are necessarily very energetic, they are the brightest stars in the Universe in absolute magnitude. They also have the particularity of no longer existing today, they are cosmic monsters from the past...

History of the discovery of the first quasars


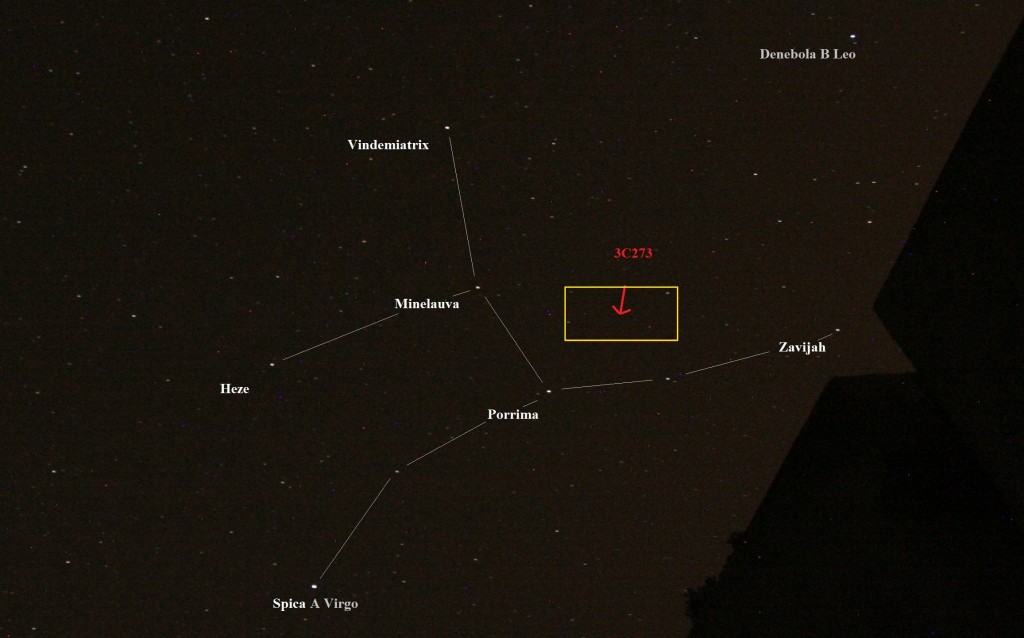
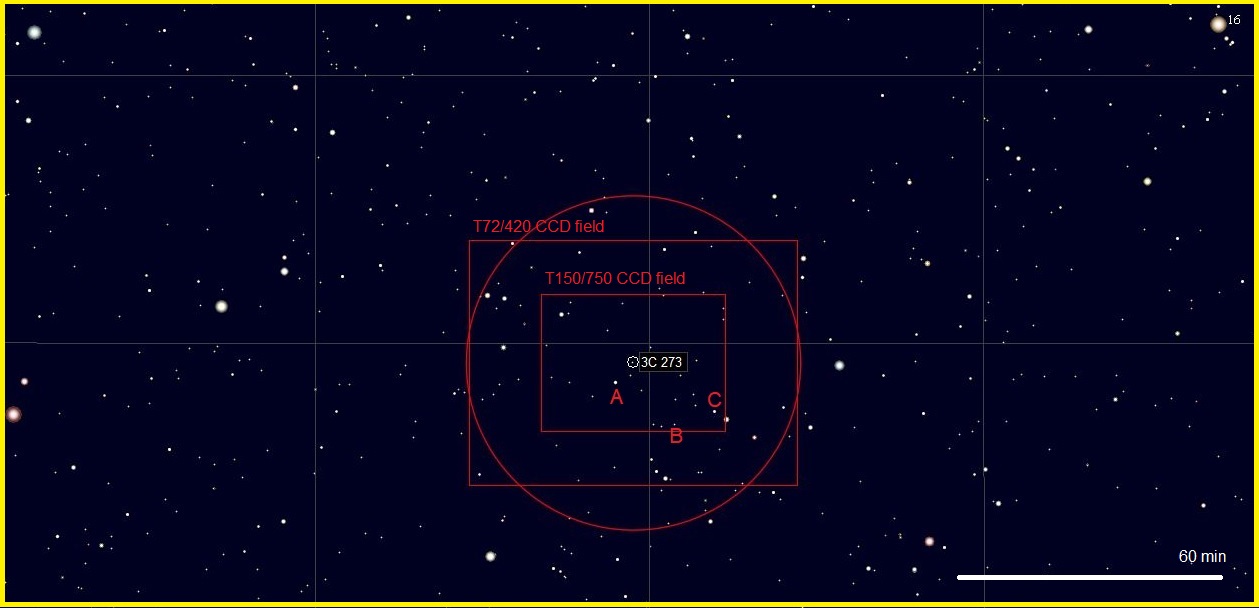
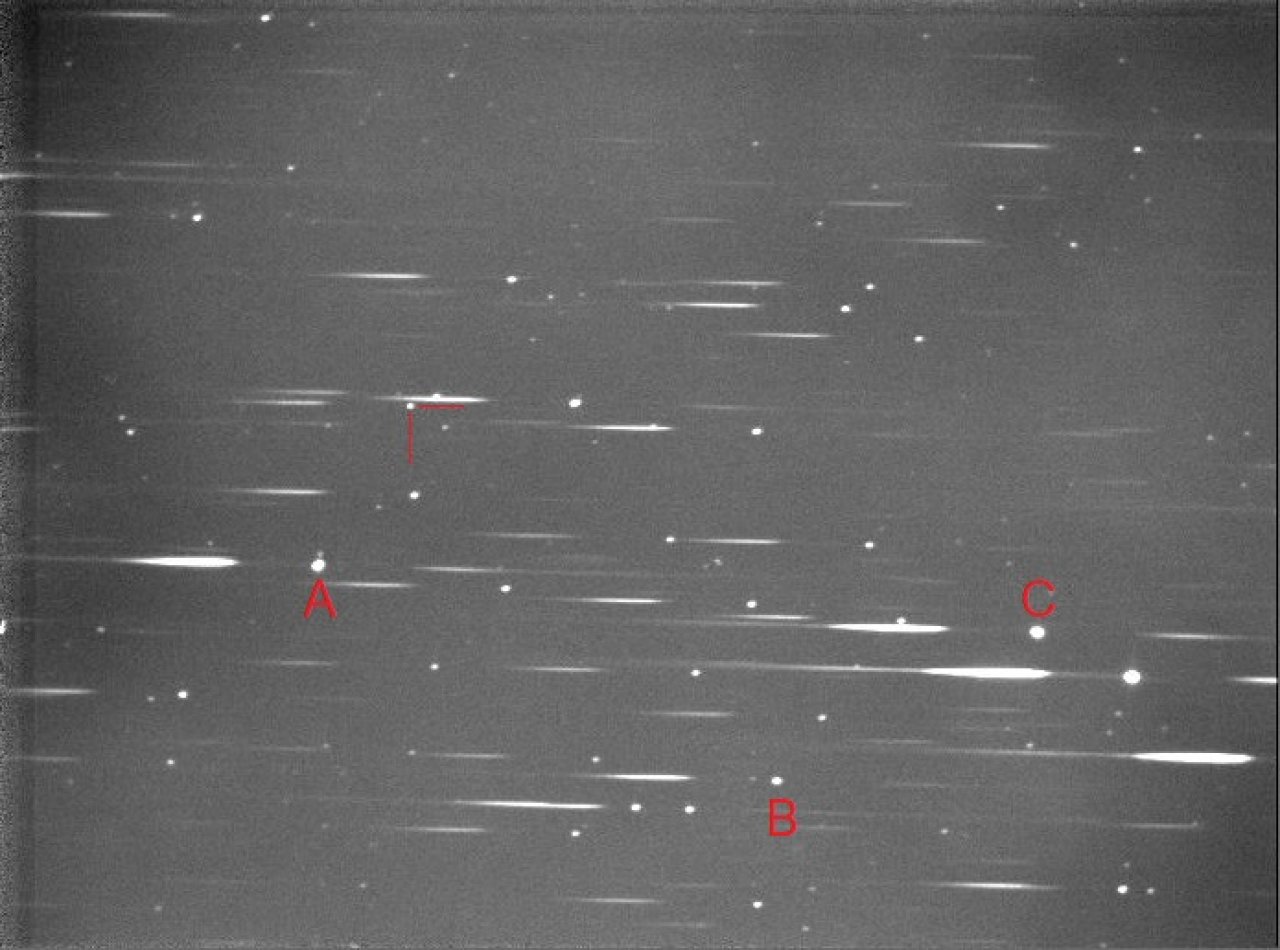
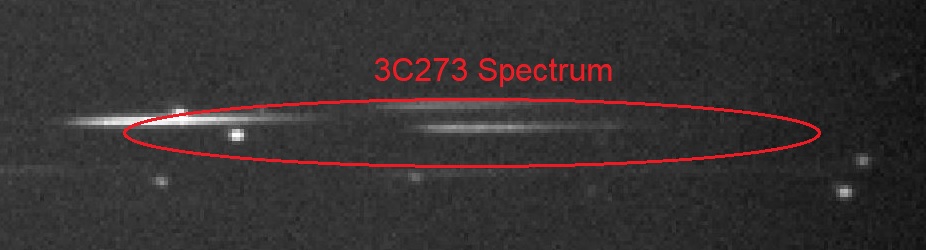
The history of understanding quasars is linked to technological developments in the 20th century. It all started with the use of radio telescopes derived from radar research at the end of the Second World War, to catalog radio sources in the sky. Astronomers have great difficulty associating a celestial object such as a nebula or a galaxy with radio sources. At the beginning of the 1960s, through the occultation by the Moon of No. 273 of the 3rd Cambridge catalog, astronomers succeeded in associating this source with... a "common" star of magnitude 12. This star has been spectrographed, but the spectrum does not resemble any other star: there are unidentified emission lines rather than absorption lines common to the majority of stars! What could this new type of star be?
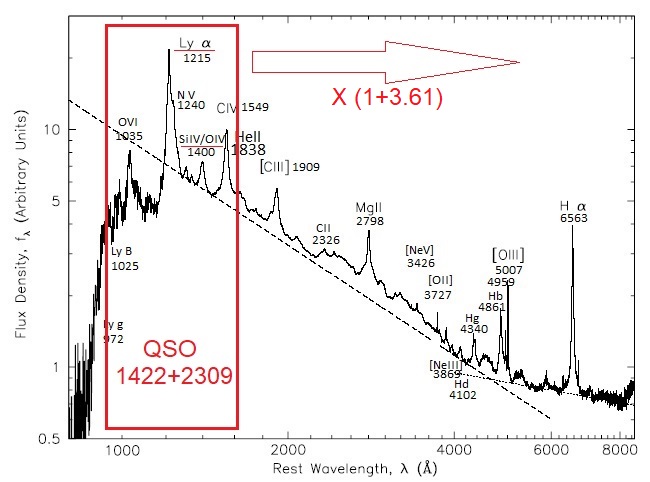
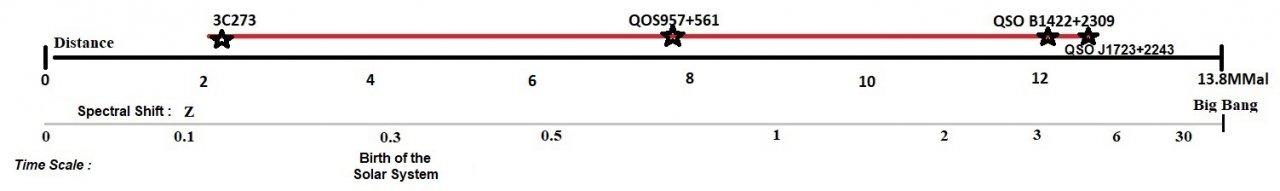
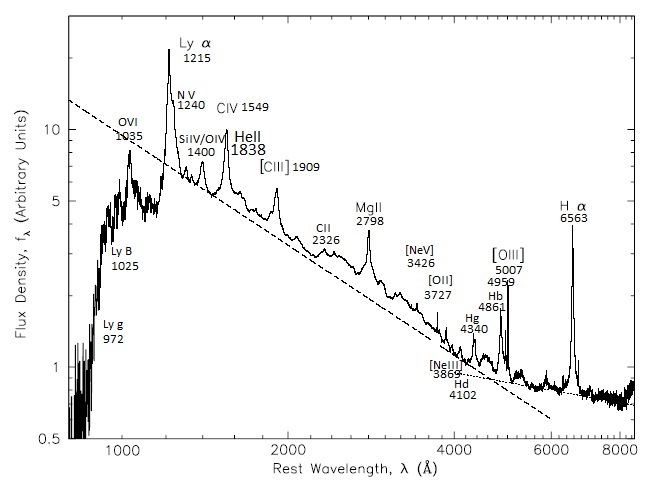
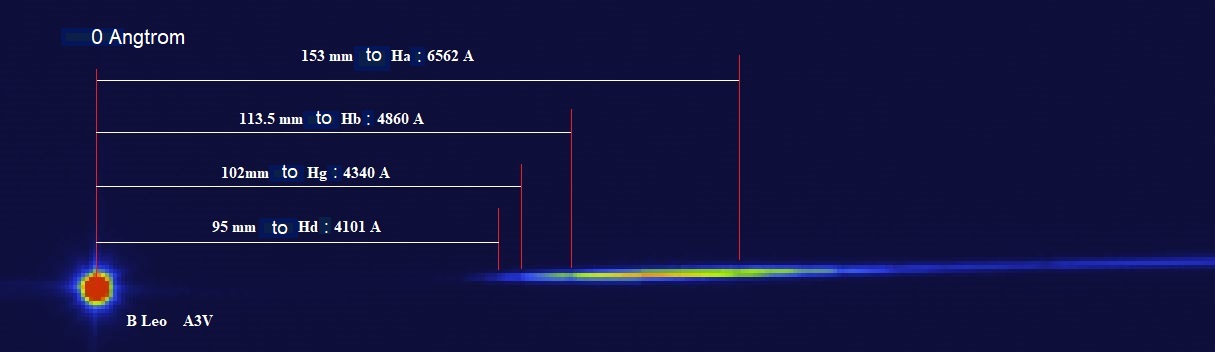
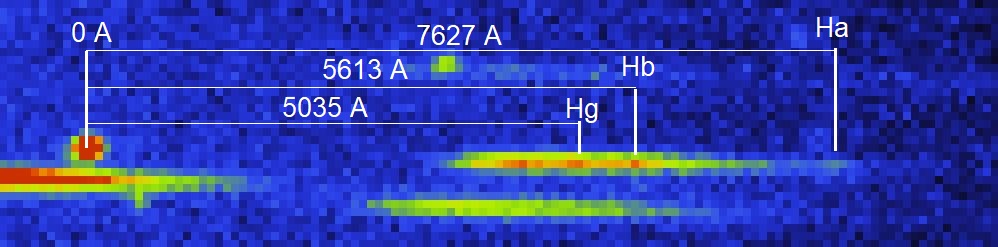
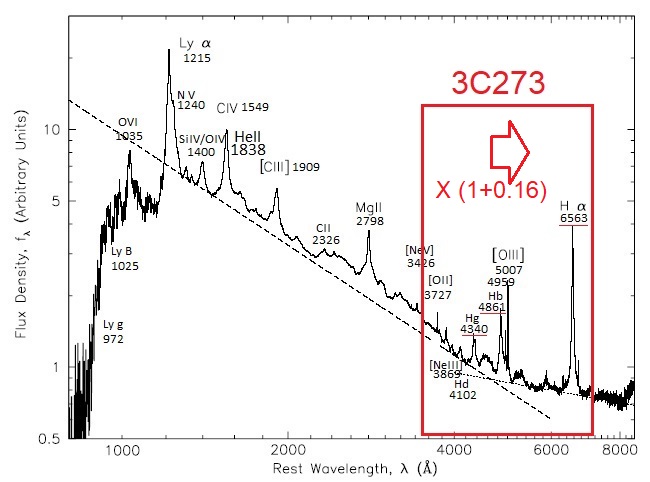
In 1963, the Dutch astronomer Maartin Schmidt found the answer: the enigmatic emission lines were identified with hydrogen lines from the Balmer series... but strongly redshifted by 16%, 3C273 with a stellar appearance is located very far away, more than two billion light years away, carried out into expanding space. In this way, this very distant quasar is a thousand times brighter than a galaxy like ours to be seen at magnitude 12. A main question arises: what is the energy that can cause such luminosity?

A quasar emits light generated by falling heated gas swirling around a super-massive black hole located at the center of a distant galaxy. Before being absorbed by the black hole, the gases compress at relativistic speeds (close to the speed of light) and it is this phenomenon which explains the extraordinary energy that is released.
Our galaxy is home to a super-massive black hole at its center which is no longer very active today because there is no longer any matter that comes into contact with it. In the past, the Universe was more condensed, there were more reserves of gas which were in motion and which crossed galaxies on their trajectories. The birth of super-massive black holes occurring in the first hundreds of millions of years of the first galaxies is a very active research subject for astrophysicists.

To summarize : observing a quasar is observing the consequences of an immense black hole in action!


The Doppler effect


The Doppler effect (1842) makes it possible to detect and measure the radial movement of a star.
If a light source moves away from an observer, the electromagnetic waves are stretched and the wavelength reaching the observer is greater than that emitted by the source. Each successive wave crest is emitted from a slightly greater distance and thus takes longer than the previous one to reach the observer.
In the context of a quasar that is moved by an expanding space that carries it, the wavelength of the quasar will increase as the space increases accordingly as seen by an observer. The observer can compare the wavelengths of the various chemical constituents of the quasar "in a still state", with those of a distant quasar moving away rapidly due to the expansion of the Universe. The emission lines of a very abundant chemical constituent like hydrogen will have longer wavelengths like waves that shift and expand towards the red.

Typical spectrum of a Quasar


We know that quasars radiate in all wave domains. They have been studied by space telescopes such as a 45cm f/d15 telescope dedicated to observation in the ultraviolet from 115 to 325 Nm, the International Ultraviolet Explorer in service from 1978 to 1996. A characteristic and general spectrum quasars was established to be able to discover new quasars (more and more distant) by recognizing spectra coming from the ultraviolet thus strongly shifted towards the red.
A quasar is listed as a QSO for "Quasi Stellar Object"


Observation and acquisition of the spectrum of the historic quasar 3C273 to measure its Redshift


The identification of one of the first quasars in history (with 3C48) has been possible today with amateur equipment for more than twenty years.


3C273 is located in the constellation Virgo.


Stellar map including the field of the ATIK Infinity CCD with two different instrumental set-up for finding the 3C273 quasar


Photo taken of 30 seconds of exposure for 50 minutes, Newton Telescope 150/750mm with an CCD Atik Infinity in Binning 2X2 and a Star filter analyze SA100


Before producing its spectrum, it is necessary to carry out the spectrum of a reference star in order to calibrate the wavelength given by the instrumentation, this star is Denebola of the constellation Leo of spectral class A3V adequate to properly identify the hydrogen absorption lines.


The first work is then to identify the hydrogen absorption lines of the Balmer series.
On the H alpha line, by dividing its wavelength of 6562 Angtroms by the distance measured on the spectrum from the origin of the star, called zero order to the associated dark line (here 153 mm) I obtain 6562/153=42.88 A/mm
For the distance with the dark line associated with H beta (113.5mm) I obtain 4860/113.5=42.82 A/mm
By averaging these two results, I obtain 42.85A/mm, with this figure, we have just carried out the calibration to calculate the wavelengths identifiable on the future spectrum of 3C273.


Extract from the photo taken of 30 seconds of exposure for 50 minutes, Atik Infinity in Binning 2X2 and a Star filter analyze SA100


Spectrum of the previous image and put in false color to better identify the lines.

To be honest, with prior knowledge of the spectral shift of 3C273 following the discoveries of 1963, I manage to identify 3 lines from the Balmer series and by multiplying the lengths from order 0 to this time I until to the emission lines characteristic of quasars, I obtain the wavelengths of H alpha, H beta and H gamma:
For H alpha: 42.85 x 178 = 7627A
For H beta: 42.85 x 131 = 5613A
For Hgamma: 42.85 x 117.5 = 5035A

I can calculate the spectral shift Z which is the difference in wavelength between a distant object and a close object divided by the wavelength of the near object:

Z for H alpha: (7627A - 6562A) /6562A = 0.1623
Z for H beta: (5613A - 4860A)/4860A = 0.1549
Z for Hgamma: (5035A - 4340A)/4340 = 0.1601
By taking an average of these 3 Zs; Z= (0.1623+0.1549+0.1601)/3 = 0.159
The measured spectral shift is worth 0.159


Using relativistic formulas, it remains to calculate the recession speed that the quasar takes to move away from the Earth:

V=C x ( ((1+Z)˛-1)/((((1+Z)˛+1)= 300000km/sec x ((1.159˛ - 1)/(1.159˛ + 1))=
300000 x 0.1465= 43951 km /seconds (i.e. the Earth-Moon distance traveled in 7 seconds!)

And finally, using a cosmologist formula for a relativistic case, it remains to calculate the distance of this quasar from the Earth:

D=V/ H0 x 3.26 = (43951 / 73) x 3.26 = 1963000 al with H0 of 73
D=V/ H0 x 3.26 = (43951 / 71) x 3.26 = 2018000 al with H0 of 71

Depending on the value of the Hubble constant H0 in Kms/sec/Mparsecs which varies according to scientific advances (73 in 2022);
Quasar 3C273 is located approximately 2 billion light years from Earth.
This spectrum was produced without treatment, without long unit exposure, from the city with a telescope of modest diameter.
In the 1960s, the largest telescope in the world at the time, that of Mont-Palomar in California (a 5 meter or 200 inch diameter) was used to identify this new type of object!
More than 60 years later, in the digital era, the goal here is to verify the identity and spectral shift of the quasar that entered history in 1963. Observing indirectly the expansion of the Universe is also today accessible to a non-professional astronomer!
Observation of a Quasar distorted by a gravitational mirage QO 957 + 561


Galaxy NGC3073 and the twin quasar QO 957+561 (lower left) in the Big Dipper


We know about double stars which are stars which actually and physically live in pairs (gravitationally speaking). Some double stars are falsely linked together because they are optically linked by perspective.

On the other hand, when we talk about double quasars, these objects which have the appearance of stars (are in fact a manifestation of very energetic radiation emitted from the center of very old/distant galaxies where a very active black hole resides ). The explanation for the existence of this double quasar (in appearance) is the fact of a gravitational mirage of a single Quasar which is split by a giant galaxy (not visible) located halfway between this quasar at 7, 8 billion al and us.


Performing the spectra of these two lights makes it possible to determine the nature of the quasar's only light source; it is a great challenge for expert, well-equipped and well-motivated amateur astronomers.

In any case, it remains possible for the majority of observers to detect in a photograph the small gap between these two lights and to delight in observing a manifestation described by Albert Einstein's general relativity (Mass distorts space-time which in turn deflects the light path of the quasar into two distinct space-time paths).

This gravitational mirage was discovered in 1979, this phenomenon of light deviation by mass was predicted by Einstein and Zwicky in 1936.


Observation and acquisition of the spectrum of a distant Quasar QSO B1422+2309


A quasar QSO B1422+2309 of magnitude 15.85 and Z 3.631 was attempted to be imaged, the goal is to identify the hydrogen line emitted from the ultraviolet, the Lyman alpha line!
It is located in the Bootes constellation.


Observed on June 25, 2022 around 12:00 a.m., 33 minutes of 30 seconds of cumulative exposures, with TN50/750, SA100, Atik Infinity


]

On this image, the values ​​in mm are the lengths measured with a ruler directly on the screen from the star (point 0) to the line identified by one or more bright pixels!


Calculation of the spectral shift Z for Lyman Alpha, the part expected to be the brightest:

Z=5623/1216 - 1 =3.624

Calculation of Z for NV (not identified with certainty):
Z=5761/1240 -1 =3.646

Calculation of Z for SiIV+OIV (the SiIV line even manages to emerge from the spectrum!):
Z=6492/1400 -1 =3.637

Or an average of Z = 3.624+3.646+3.637 /3= 3.636

If I remove the Z from the NV line which is not precise:
Z=3.624+3.637 / 2 = 3.6305

to compare with the official Z which is 3.631, the result is consistent!

Calculation of the recession speed gives:
V=C x (((1+Z)˛-1)/((((1+Z)˛+1)= 300000km/sec x ((4.632˛ - 1)/ (4.632˛ + 1 ) ) =
Vc = 300000 x 0.91 = 273000 Km/sec !


The 12 billion light years of the Earth, the photons detected were emitted 1.6 billion years after the birth of the Universe.

Consider that today, detecting by a digital sensor (not observing!), a faintly luminous star coming from the beginning of the Universe, in the exquisite sky of one of the largest cities in France, from a terrace of a building with a classic telescope for beginner astrophotographers is possible!

What is also wonderful is is that with the help of science, the observer can detect and identify the object, then measure and calculate the distance which separates it from the Quasar thus accessible.

From the calculation of its Redshift, the escape speed of the Quasar becomes so important that we feel the extraordinary manifestation of the expansion of the Universe which began to place the Cosmologists of the last century on the path of the famous Big Bang theory!


Very distant quasars (located more than 10 billion light years away) are identifiable by the presence of the strong Lyman alpha line of hydrogen emitted from the ultraviolet.
Beyond the Lyman alpha line, there are other secondary lines of the Lyman series that can be absorbed, forming the definition of a "Lyman forest". The "Lyman forest" is widely studied by professionals who analyze a quantity of absorption lines giving information on the concentration of gas present in the ambient environment of the space of the first billions of light years of the Universe.


| The Universe | Practise - Observing | Our Galaxy - The Milky Way | Galaxies | Quasars - Expansion of the Universe |

Observing the Universe - Quasars - Expansion of the Universe (Sciences - Astronomy)    -    Author : Frédéric - France


1557 visitors since 2024-03-24
Last update : 2024-04-28

Blog-City.info >> Sciences >> Blog #33795

Create your own
WEBSITE !
Make new friends all over the World !
Make penpal friends with StudentsoftheWorld.info

Visit France !

website author area
Password :
Forgot password? - unpublish